Your Roofing Company's Bell Curve and 2018 Revenue Goals
nderstand your company’s Bell Curve, and you’ll understand sales and marketing forecasting, so your company excels during both peak season and slow months.

What is your industry’s bell curve?
As you think of an answer, let me explain why your answer matters.
If you own or run a home improvement business, you know how challenging it is to stick to a marketing schedule, meet sales expectations and targets, strengthen your sales and production bench, motivate your reps, and ward off negativity during the tougher months.
Most business owners or general managers respond to these challenges with a mish-mash of educated guesses and forecasting. Sometimes they work. Most times they don’t.
Every challenge listed above is tied to cash flow, and cash flow problems are the #1 reason businesses fail, according to U.S. Bank.
Fortunately, you can stay ahead of the curve, beat the competition, and maintain healthy cash flow. How?
Use the bell curve. A bell curve is the shape of a line when plotted on a graph to represent a set of data with highs and lows — and every home improvement business owner knows highs and lows.
Understand your company’s bell curve, and you’ll understand sales and marketing forecasting, so your company excels during both peak season and slow months.
Here’s why bell curves matter:
Your company has several bell curves. Your sales curve tells you which months will produce higher gross sales than others. Your appointment curve tells you when a lighter leads month is coming and when to push your team to focus on follow-up and close any remaining potential deals hanging around. Your production curve tells you when to build your crew bench. Your marketing curve tells you when to shovel money into media, events, digital campaigns, and other advertising strategies.
Having this data at your fingertips gives you more control over your business than you’ve ever had. Bell curves are the closest thing to a crystal ball.
Think of 2018 as a roller coaster. This year, you have 12 data points to predict where the hills, turns, spirals, and drops are. Speaking of roller coasters, my favorite parts of a roller coaster ride are those unexpected drops, turns, and corkscrews. But in business, I like knowing what’s coming. I want to know when to make decisions that enable large revenue increases before I need to make them.
You can’t change the market, but you can plan for twists and turns. Like the stock market, you don’t have enough money to change the market’s overall direction. If you knew when a certain stock would fall, you could jump out and protect your money. Of course, that’s insider trading, which puts people like Martha Stewart behind bars. In the home improvement industry, knowing when to spend money and when to keep the wallet in your pocket is totally legal — and it’s called strategic bell curve forecasting.
Negotiating the Curve
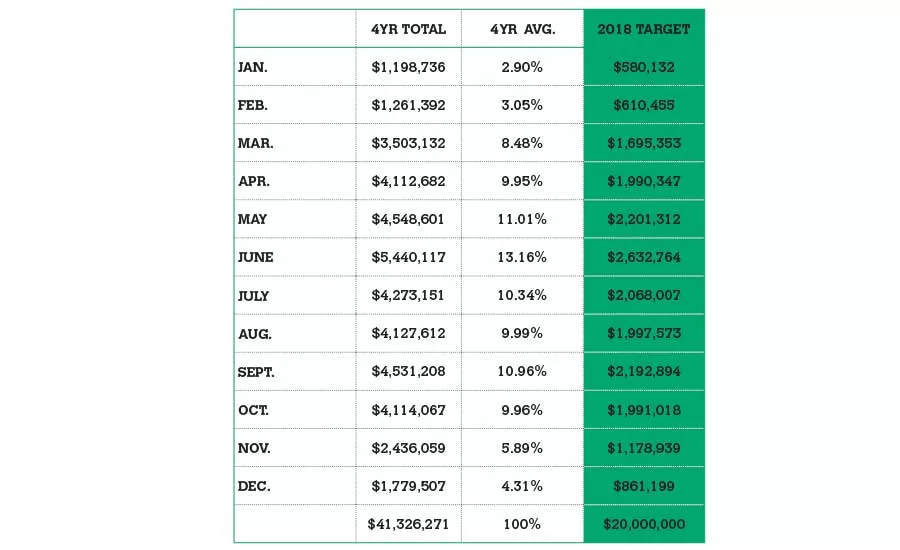
Determining your company’s curves can be done in several different ways. If you’ve been in business more than six years, the last four years’ numbers will give you your average curve. A four-year average is the most accurate way to forecast sales over 12 calendar months.
Once you have those data points, turn each monthly amount sold into a percentage of the total. This information allows you to break your annual goal down into smaller, month-to-month goals.
In the first column (4YR Total), I’ve added each month’s total from the last 4 years of business. In the second column (4YR AVG.), I’ve calculated that specific month’s percentage of the 4-year total. In the third column (2018 Target), I’ve written the annual goal in the last row and multiplied each month’s percentage into the goal.
Your sales curve average (4YR AVG.) may look very similar to this once you’ve done these calculations for your own business. The sample (on page 17) is from an Ohio-based client, so if you’re in a warmer climate, you may not have such drastic seasonal changes.
Every spring in Ohio, residential roofers get excited for an initial uptick in business. Prospects are deciding which home improvements to prioritize with their tax return money, and the home shows they attend offer plenty of inspiration for their budgets.
Depending on when your season starts, this is a great data point to place on your marketing curve. At least one to two months prior to your expected spring uptick, market heavily to your prospects so you’re top-of–mind when they decide which company to call. Maintain that strong marketing push depending on each month’s predicted volume from early March through early October, then slow down to a stop mid-November.
A pre-planned marketing schedule like this is vital to your success. Companies fail most often when they market reactively, rather than proactively. You’ll pay more for your marketing, and you’ll always be too late. You’ll never be able to compete with Santa Claus during the holidays or during major elections when political candidates slam TV, radio, and direct mail from August through early November.
Your sales curve also helps you map your production curve. The product manager’s job is a combination of juggling act and air traffic controller. Everything comes at them at once, all the time. And when it rains, it’s almost impossible to reschedule for next week when even more jobs are already scheduled.
If you’ve diligently tracked install dates, you can create a production curve based on the last four years to determine when to prepare for heavier installs and repairs, when to hire more labor help, and when to train production staff for increases in jobs. If you haven’t tracked production data for the last four years, simply repurpose sales curve data to determine when you sell and install most jobs.
Over the last 12 years leading sales teams, I’ve had many tools at my fingertips to continually increase companies’ sales by large margins year over year. The sales curve remains my favorite tool. It’s ALWAYS open on my computer screen.
While most sales reps live for today, this week, and this month, every business owner and sales manager needs to look at the next three months. Are you coming up on the biggest month of the year? Do you have enough salespeople to reach your goal? Is your marketing manager ready to help hit the estimated numbers of leads required for the goal? What training do your teams need to be prepared? Is a slow month coming up? Are your salespeople ready to work on their pipelines from the last six months of prospecting? Has your management team memorized motivational scripts to curb slow-month negativity?
Only you, the business owner, knows these answers. But with the bell curve’s help, you can find the answers in the first place.
Looking for a reprint of this article?
From high-res PDFs to custom plaques, order your copy today!
.webp?height=740&t=1781278983&width=auto "KEE(2).png")


