Economic Indicators
Construction Materials Prices Remained Unchanged in August
Producer Price Index report cites energy costs as a primary driver of specific increases even as the overall index remains flat

The Consumer Price Index, which is the broadest measure of consumer prices, rose 3.7% annually in August, up from 3.2% in July. According to Curtis Dubay, chief economist at the U.S. Chamber of Commerce, inflation is down from the peak of 8.8% in June 2022 but still above the Fed’s 2% target rate. Unlike the CPI, The producer price index drills down on specific prices affecting trades like roofing.
— Top image courtesy of Advantus Media; charts courtesy of Yield Pro
The monthly producer price index report from the Bureau of Labor Statistics, released last week for August 2023, showed that construction materials prices remained unchanged month-over-month in August on a seasonally adjusted basis.
The index of components and materials for construction was down 0.4 percent from its year-earlier level even with overall prices for processed goods, for intermediate demand, rose by 2.1 percent in August, driven by a 12.1 percent rise in the index for fuels and lubricants, according to the BLS. Other components of the PPI index were either flat or down for the month. The processed goods for intermediate demand index was 4.3 percent lower than its year-earlier level.
For reference, the changes in these indexes compare with a 3.7 percent rise in the all-items consumer price index (CPI-U) for the 12 months ending in August. The seasonally adjusted August CPI-U was up 0.6 percent from July’s level. The monthly inflation rise was driven by a 5.6 percent jump in energy prices. The shelter portion of the CPI-U was up 0.3 percent for the month and was 7.3 percent higher than its year-ago level.
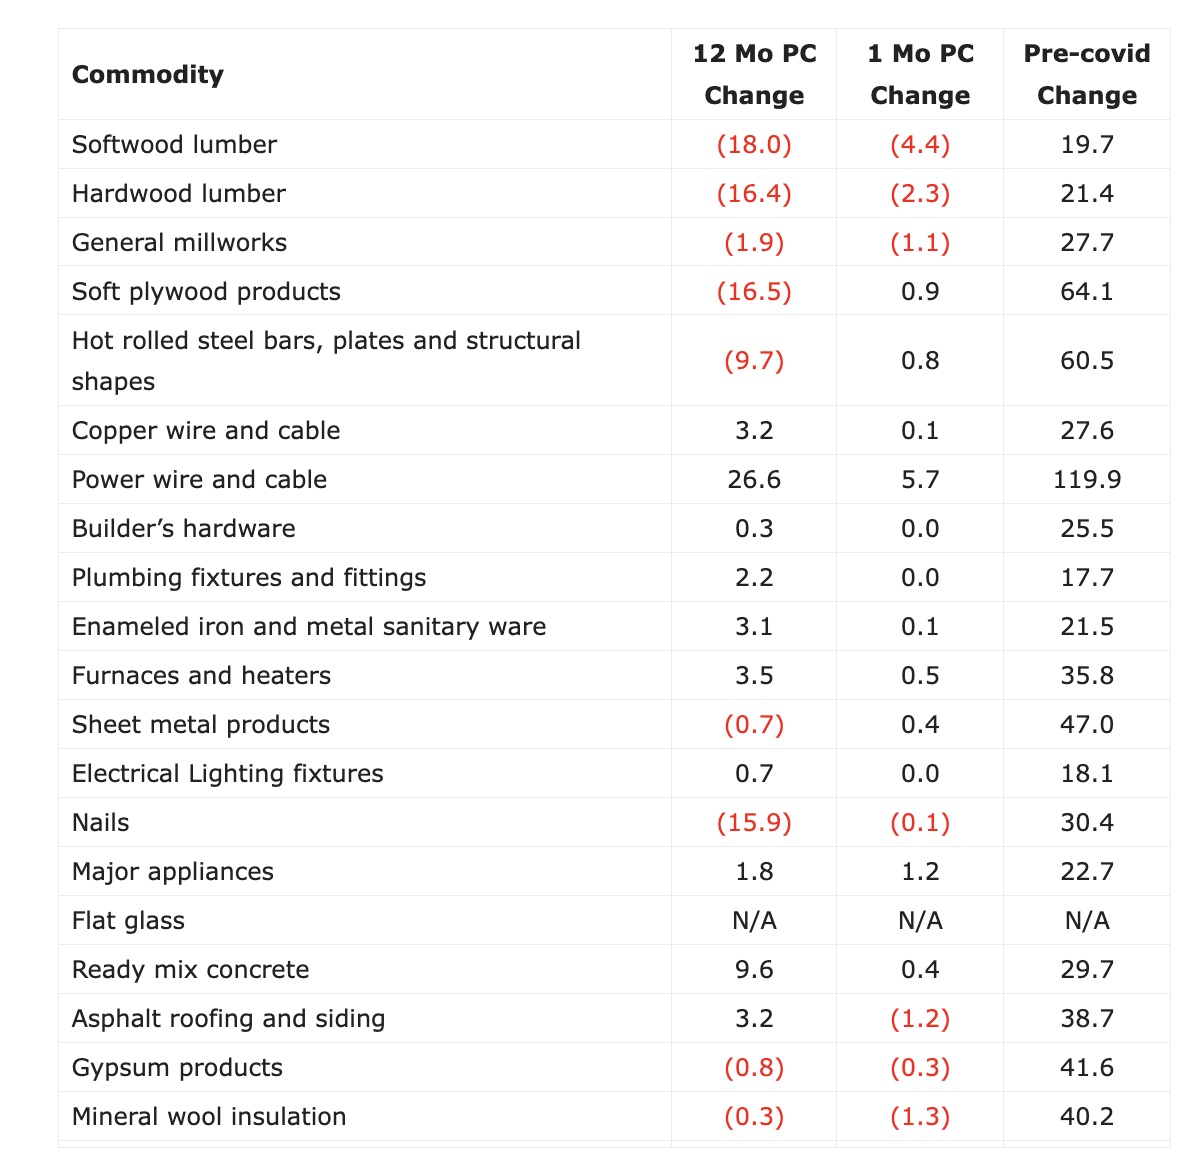
Yield Pro, a trade news site for the multi-unit and rental housing industry, compiled the BLS-reported changes for the news site’s standard list of construction materials prices affecting various aspects of the building envelope, including roofing.
These materials directly impact the cost of construction, particularly in the residential and multi-unit sectors. The two right-hand columns of the table provide the percent change in the price of the commodity from a year earlier (12 Mo. PC Change) and the percent change in price from July (1 Mo. PC Change). If no price data is available for a given commodity, the difference is listed as N/A.
The pre-COVID column lists the current construction materials prices change relative to the average prices from December 2019 through February 2020, before the pandemic impacted the economy. Yield Pro uses pre-COVID numbers as a ‘control’ to offer a “truer idea of the magnitude of the recent price increases for materials,” such as lumber, where prices were already rising sharply last year, than does the 12 Mo PC Change column.
The next chart below shows the price index history for wood products over the past 37 months. Note that the prices used by the BLS in compiling the indexes are collected on the Tuesday of the week containing the 13th day of the month. In August, that would have been August 15. In the September report, the data collection date will be September 12.
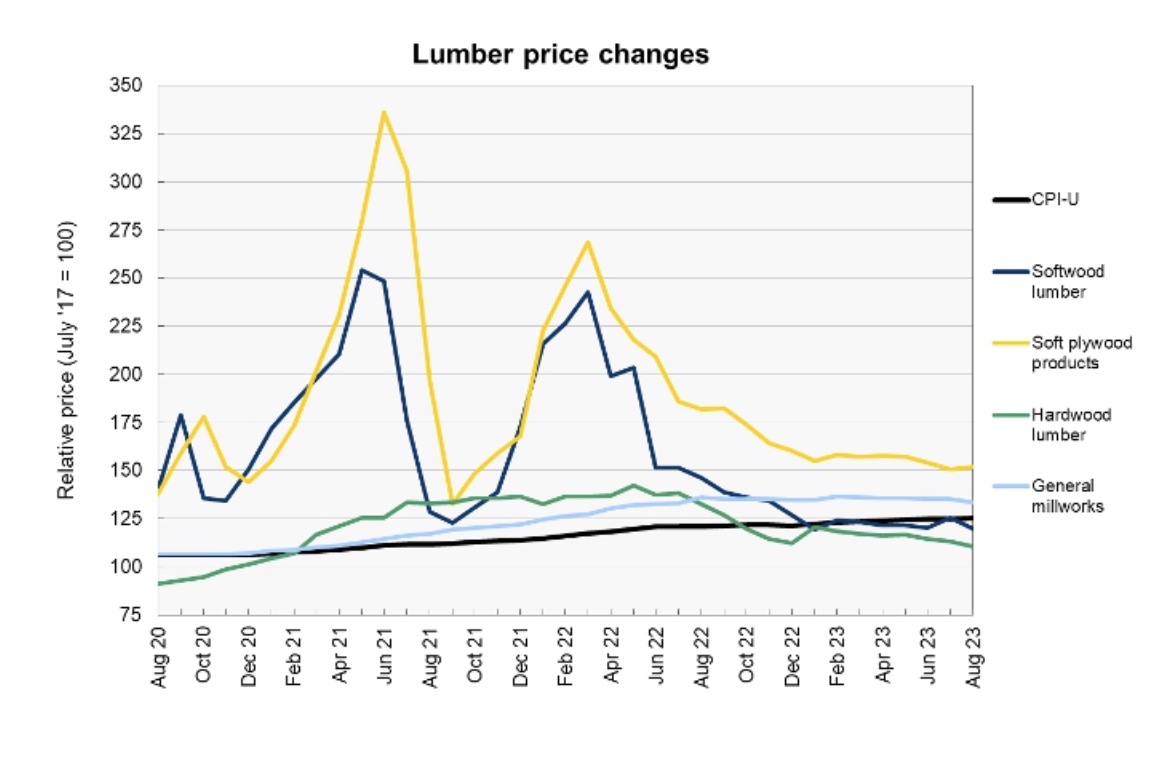
Wood products have been relatively stable during 2023. The price index for softwood lumber was reported to drop 4.4 percent this month, but this only reversed last month’s gain. The current price index for softwood products is within 1 percent of its price index in January, as is the price index for general millwork. The index for soft plywood products is down 2 percent since January. Only the price index for hardwood products has changed significantly since January, falling 8.3 percent.
Looking ahead, NASDAQ reported that the market price of lumber closed on August 15 at $512 and fell to $497 on September 12. Lumber prices in the futures markets indicate that only nominal price changes are anticipated for the months ahead. The November 2023 contract closed on September 12 at $499, while the January 2024 contract closed at $513.
The following chart below shows the recent history of several other construction materials prices. These are relatively simple commodities whose prices are strongly driven by those of the materials of which they are comprised.
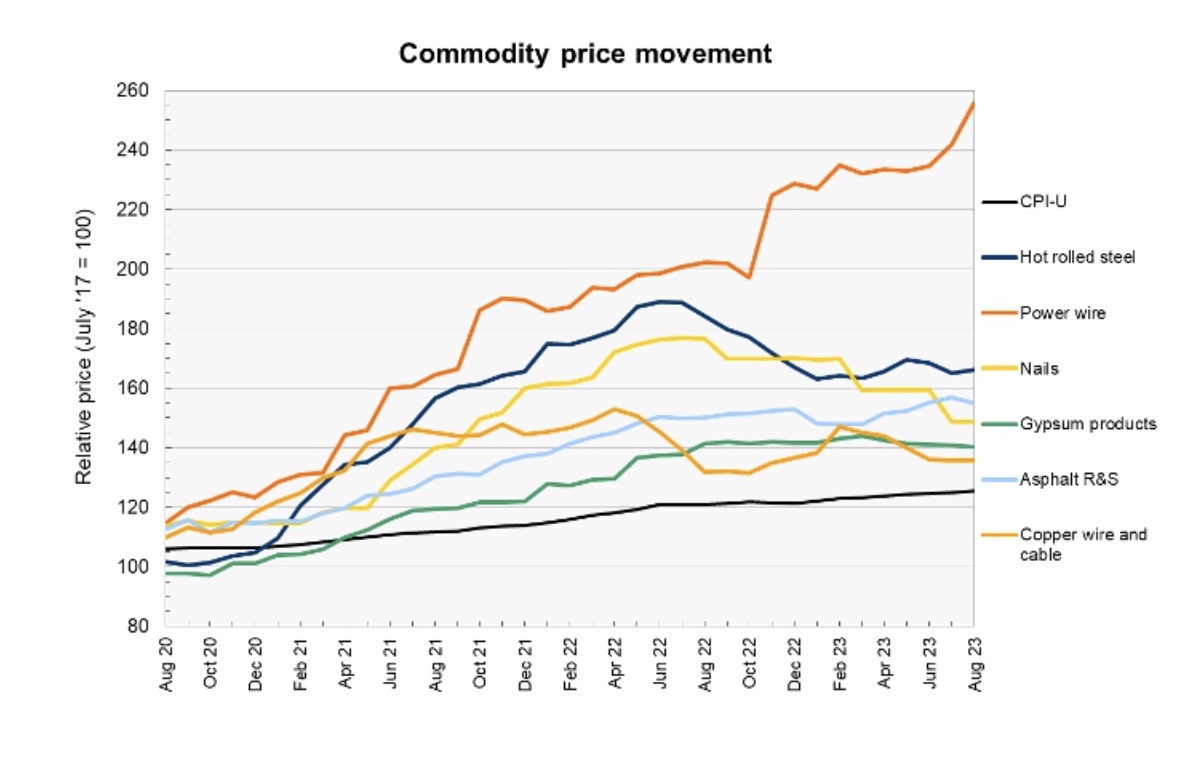
Power wire and cable prices had the highest upward movement in August of the construction materials prices Yield Pro tracks, with a rise of 5.7 percent. The increase follows last month’s rise of 3.1%. Its price index has now experienced the most significant post-pandemic growth of the construction materials prices economists track. Its 120 percent rise is nearly double that of the next highest construction materials price index increase.
Other than power wire and cable prices swinging upward in August, price indexes for other construction materials have been relatively stable this year; the price index for nails has fallen 12 percent, while the price index for asphalt roofing and siding has risen 4.5 percent.
Looking ahead at prices for underlying materials, MarketWatch reported that the NYSE American steel index ended the last 30 days only slightly higher than the point from which it started. It closed at $1,926 on August 15 and $1,940 on September 12, although it traded as high as $2,019 between these dates.
Meanwhile, steel futures have trended lower since Yield Pro’s last report. The November contract closed 3% lower on September 12 than August 15. However, on September 12, the January 2024 contract closed 8% higher than the November contract; analysts say that the market predicts that steel prices will rise.
The price of copper closed at $3.79 per pound on September 12, up $0.08 since August 15. Between those dates, it had closed as high as $3.85 per pound and as low as $3.70 per pound.
The price of aluminum moved higher in late August. It closed on September 12 at $2,196, up $52 from its level on August 15. However, the August 15 price was near a recent low.
Looking for a reprint of this article?
From high-res PDFs to custom plaques, order your copy today!

Bryan Gottlieb is the online editor at Engineering News-Record (ENR).
Gottlieb is a five-time Society of Professional Journalists Excellence in Journalism award winner with more than a decade of experience covering business, construction, and community issues. He has worked at Adweek, managed a community newsroom in Santa Monica, Calif., and reported on finance, law, and real estate for the San Diego Daily Transcript. He later served as editor-in-chief of the Detroit Metro Times and was managing editor at Roofing Contractor, where he helped shape national industry coverage.
Gottlieb covers breaking news, large-scale infrastructure projects, new products and business.
![]()
email gottliebb@enr.com | office: (248) 786-1591
.webp?height=740&t=1781278983&width=auto "KEE(2).png")


